Financial Engineering Is Probably Not an Important Systemic Problem
Since the financial crisis of 2008, there has been an understandable concern about the potential for catastrophic risks and the use of debt within American financial markets. In a new report, Oren Cass at American Compass has taken aim at what he refers to as “Coin-Flip Capitalism”. Many of his concerns relate to the niche market of leveraged private equity. However, some of his proposed solutions relate to publicly traded firms. His three solutions for reducing financial engineering, which he associates with poor capital allocation, are (1) more disclosures for firms seeking to be listed on public exchanges, (2) a ban on share buybacks, and (3) a transaction tax on publicly traded shares.
These proposals extend well beyond niche private equity markets and are based on a presumption that financial engineering is a broad and systemically important element in current American capital markets. Cass writes that, “The diffuse and anonymous ownership of the modern corporation encourages increased risk-taking and leverage…” This is quite an opposite problem than leverage related to private equity takeovers. Cass asserts that, “Net business investment as a share of GDP has been declining for decades and major corporations are increasingly choosing to disgorge their profits back to the financial sector rather than invest them in maintaining and growing their capital stock.”
Leaving aside targeted and anecdotal concerns regarding private equity activities, caution should be used in expanding these concerns to American financial markets more generally. Is there really a trend toward excessive leverage, over-engineering of American corporate capital, and underinvestment? Not only is the evidence mixed on these assertions, by some measures it is decidedly in contradiction of them.
Are American Firms Systematically Overleveraged?
If there are pockets of overly reckless leverage among American businesses, they do not appear to be widespread. Basic measures of aggregate corporate leverage are low or moderate.
Figure 1 presents two long-term measures of corporate leverage tracked by the Federal Reserve. Debt held by corporations has been a stable portion of estimated market-valued net worth for three decades. Debt has been falling precipitously compared to market capitalization (the value of corporations measured by the value of shares outstanding) over that same period of time. There has not been a systematic increase in the use of debt among nonfinancial corporate businesses.
The increasingly global footprint of American corporations can cause confusion on this topic. For instance, corporate debt has been increasing compared to US GDP. That is mostly due to the increasing amount of foreign revenue that US corporations earn. It is important to remember that in many cases US GDP is not an accurate baseline for scaling corporate operations and balance sheets over time.
Are American Firms Showering Shareholders with Cash?
If some American firms are increasingly disgorging profits back to shareholders rather than reinvesting, this also appears to be a niche activity that does not show up in aggregate trends. Cass points to share buybacks as part of the problem, and recommends reversing a 1982 rule passed during the Reagan administration that allows firms more flexibility to buy back their own shares.
Cash is primarily returned to investors in two ways — dividends or share buybacks. Dividends are distributed evenly among all shareholders. Buybacks are distributed specifically to shareholders who choose to sell their shares. There is little difference, outside of tax implications, between the two. For instance, consider that many brokers allow shareholders to automatically reinvest dividends back into more shares of the firm. In a market where all shareholders chose to reinvest dividends, there would be no difference between these two methods of cash disbursement, except for the arbitrary number of shares outstanding.
Cliff Assness, at Applied Quantitative Research, has been among the more vocal financial experts pointing out that many of the complaints about buybacks are unfounded. Without getting into the details of that debate, buybacks simply have not been associated with higher aggregate rates of cash payouts to shareholders.
According to long-running estimates by Yale finance professor Robert Shiller, from 1871 to 1982, when the buyback rule was amended, dividend yields averaged 5% annually. When the buyback rule changed, dividend yields declined. Since then, they have averaged about 2.4% annually. And, buybacks increased from a negligible amount in 1982 to around 2% to 3% of market capitalization in recent years. In other words, the average total cash yield (buybacks plus dividends) to investors has remained between about 4% to 5% for at least 150 years. If anything, the trend is slightly downward.
Are American Firms Pocketing High Profits Rather than Reinvesting?
There also doesn’t appear to be a long-term trend of declining investment. Cass references a specific estimate of investment within firms, which appears to have declined over time. But, aggregate estimates of investment activity, tracked by the US Bureau of Economic Analysis, much like measures of shareholder cash yields, show remarkable stability over decades.
Figure 2 displays nonresidential investment and operating surplus (roughly profit plus interest expense) over time, both as a portion of GDP. If anything, there has been a long-term increase in investment and a decrease in operating surplus, though both have been relatively stable for decades.
Since corporate leverage has been stable or declining over the past several decades, less of that operating surplus has been paid to debtors as interest and more has been paid to shareholders as profits. The more cyclically robust equity component of corporate capital has been an expanding part of corporate finance over the past few decades. So, as a percentage of GDP, domestic investment has been stable, domestic operating profits have been stable, and debt has been a less important component of those operating profits, over time.
Leverage (or lack of it): America’s Largest Public Firms
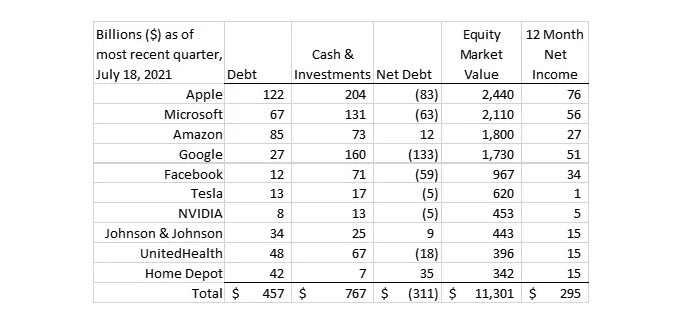
There is especially a lack of leverage among America’s largest public corporations, many of which have been the drivers of recent economic development. Below is a table of the ten largest non-financial US public corporations.
The largest American firms are net creditors. In other words, they have more cash and investments in securities than they have debt. Leverage is practically irrelevant to the operations of America’s leading firms.
The leading American firms are surprisingly untempted by leveraged profit-maximization. Surely, they could collectively issue trillions of dollars of debt at negative real interest rates in today’s market. Yet they don’t.
The capitalization of the leading American corporations suggests that leverage is not a driver of stock market appreciation. The aggregate price/earnings (PE) ratio of these top firms is well over 30. Low interest rates are frequently cited as a reason for such high valuations, but if the market value of these firms is sensitive to interest rates, it certainly isn’t because they are binging on cheap credit.
Unintended Consequences: America’s Housing Market
The lack of widespread corporate leverage suggests that policy responses to financial engineering should be targeted rather than broad. The experience of the housing market suggests that even targeted policies should be imposed with caution. Pre-2008 housing markets were a prime example of a market that called for targeted regulation aimed at reducing financial manipulation. A variety of policy responses have greatly reduced lending to financially marginal homebuyers. Markets in the toxic securities that blew up in 2008 also have subsided. What has been the result?
Figure 3 highlights long-term patterns in housing and residential investment. There was relative disinvestment in housing during the Great Depression and World War II, so Americans spent less for relatively less housing. Then, there was a recovery in residential investment. During that time, Americans spent more on housing and got more housing for that spending. Then there was a period of relative stasis. Until about 1980, residential investment averaged just over 4% of GDP, and this appears to have maintained the housing stock at a stable 8% of GDP. Then, after 1980, residential investment was generally below 4% of GDP, yet the rental value of the housing stock resumed its rise. In other words, Americans were not getting more housing, but they were paying more for it. This trend was briefly interrupted from 2003 to 2007, after which the clamp down on financial engineering pushed housing back into that long-term trend: less investment and higher costs to tenants.
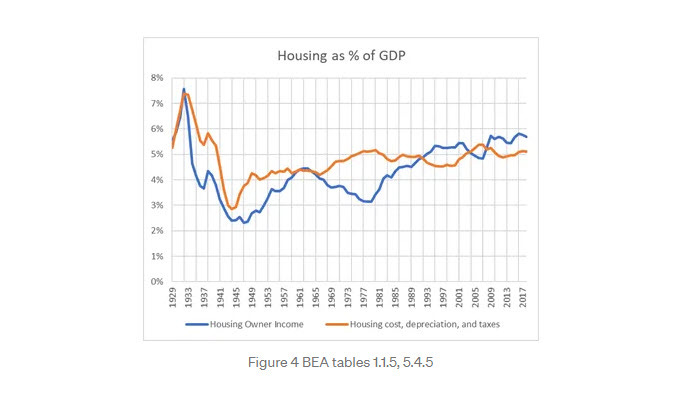
Figure 4 further highlights these shifts by separating the rental value of US housing stock into (1) the operating costs and depreciation of housing and (2) the rental income that remains after those costs. Since 1980, the cost of the shelter consumed by Americans has remained level at about 5% of GDP, but the income retained by real estate owners and lenders has grown from 3% of GDP to nearly 6%. This was briefly reversed during the boom in mortgage finance before 2008. Briefly, during the building boom, more of housing was being claimed as consumer surplus rather than producer surplus. But, when the mortgage market was tamed, the trend toward more producer surplus returned.
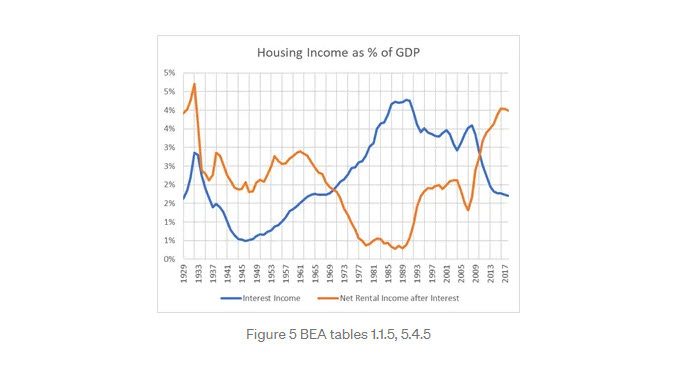
As figure 5 further clarifies, the new increase in income to capital in housing went to owners. Housing capital is provided by (1) creditors who earn interest and (2) owners who earn rental income. Clamping down on financial engineering did succeed in reducing the use of debt. It succeeded in reducing interest income from housing. However, this has not resulted in positive outcomes for consumers. Investment has collapsed, and more of tenants’ rental expenses are being claimed by owners.
Less financial engineering = less leverage = smaller role for financial sector = higher costs and fewer amenities for tenants. The point here is that even in a case which seems like the poster child for unproductive financial activity that needed to be regulated, that regulation has likely left consumers worse off.
Conclusion
There will always be some amount of short-sighted, pro-cyclical, extractive financial activity that might cause us concern. It is reasonable to want to do something about it. In our attempts at doing something about it, there are layers of mitigating considerations we should keep in mind. First, is our reaction itself a product of our own short-sightedness or pro-cyclical sentiment? Second, will the imposition of our preferred policies create unforeseen side effects? And, third, is the problem we are addressing truly a systemic issue? Are the priorities implied by our concerns the right priorities?
All of these mitigating issues are more difficult to get right than it seems. In the case of “coin flip capitalism”, it might be possible that even at the broadest level, the sign is wrong. Intuition would lead us to expect firms to load up on debt when it is cheap. But how much is the causation going the other direction? Are interest rates being driven lower because our leading firms aren’t interested in issuing more debt at any rate?
Maybe there isn’t enough debt financing. Maybe one reason for what many refer to as a shortage of safe assets is that our financially strongest corporations are unwilling or unable to provide safe assets for the market to the extent that large firms once did. Maybe the low interest rates that induce some niche activity among financially marginal firms are the result of a lack of reasonable leverage among firms that could safely use it. Maybe, rather than banning share buybacks, we should be asking Apple and Google what it would take for them to buy back more.


