On SVB’s Failure and Other Bank Distress: What’s Going On?
SVB and Signature Were Bank Failures, Not Necessarily a Banking Crisis
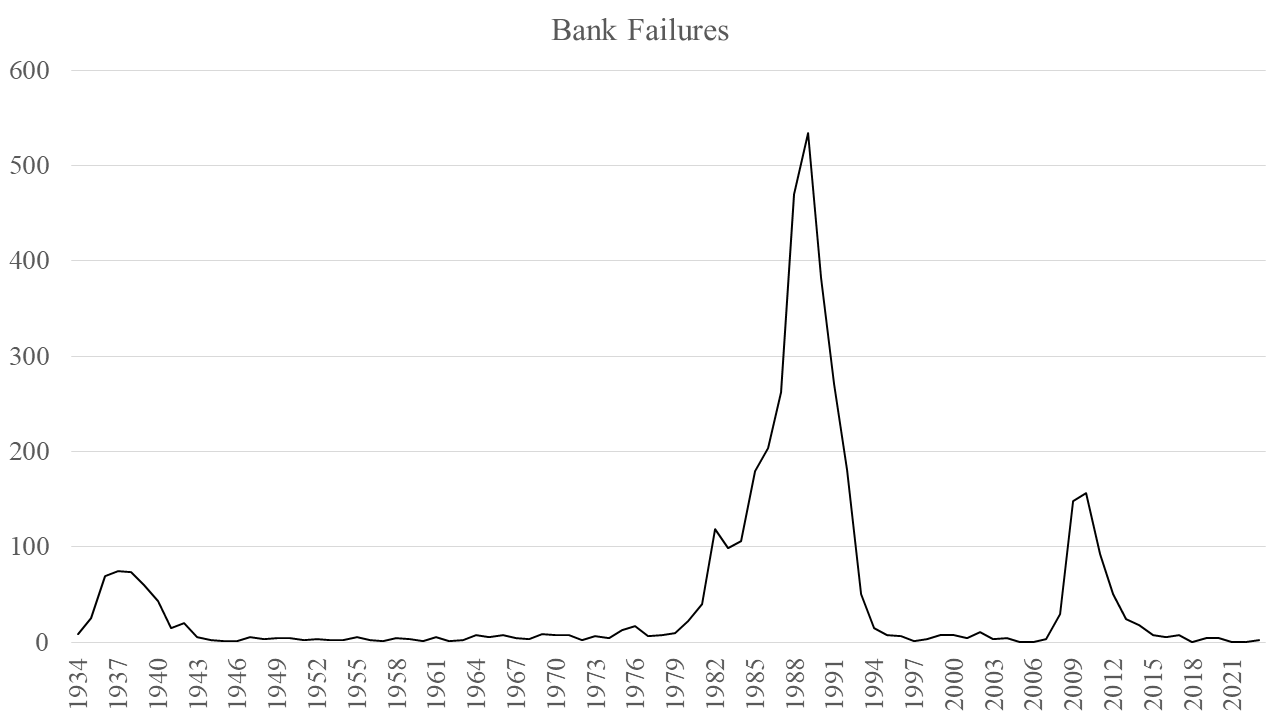
Silicon Valley Bank (SVB), with over $200 billion in total assets, and Signature Bank, with over $100 billion in total assets, have put bank failures back in the news again. Silvergate Bank, with over $11 billion in total assets, chose to close shop before it actually failed. Other banks have faced concerns over possible distress. Given that we still have about 4000 commercial banks in the U.S., a few bank failures a year is nothing out of the ordinary – the average/median number since 1934 when the Federal Deposit Insurance Corporation (FDIC) began reporting failures, equals 46/7. Through March 14, 2023, this year there have been two failures (SVB and Signature), which still lies below the average and median since 1934. While it’s still too early to tell if we will have a banking crisis, recent research suggests that you can have banking crises without a broad panic, when bank stocks decline significantly, as we have seen for some banks in the current inflationary bear market. The Federal Reserve’s drastic measure to create a Bank Term Funding Program accordingly seemed aimed at restoring confidence.
Now, when you don’t have any bank failures in a year, or when you have many as the graph below from the FDIC’s failed bank list shows, that’s when you should worry. Prior to SVB and Signature Bank, the last bank failures were in 2020, which means more than two years passed without one, even during COVID-19 pandemic. That may reflect the extensive government support offered to people and businesses. The three peaks from left to right in the series below reflect the tail end of the Great Depression (there were many more prior to the creation of the FDIC), the Savings & Loans Crisis that took roughly a decade to play out and the 2007-2009 Crisis, respectively. With these general facts in mind, let’s look into what happened with SVB.
What Was SVB Up To?
Matt Levine in a recent piece summed up their problem nicely, as he points out that most banks take on credit risk by lending to a wide variety of customers, but SVB attracted a large pool of deposits from startups that had received funds from venture capitalists, who in turn were not in want of loans – they already had the funding but just wanted a place to park it. If you go to this link for the call report for “Silicon Valley Bank”, you’ll see on pp. 50, 51 that the bank reported $175.488 billion in total deposits, and of that amount $4.778 billion were in accounts with balances under $250,000, but a whopping $156.747 billion were in accounts with balances above $250,000. On net, that meant SVB relied on $151.592 billion funding that were uninsured and therefore prone to runs – it would be useful to know if senior bank management and bank supervisors were concerned about this.
Without customers to lend to, SVB staff instead parked the deposits in securities, especially Mortgage Backed Securities (MBS) arranged by Freddie Mac and Fannie Mae and implicitly backed by the government. On p. 22 of the same SVB bank call report discussed above, the bank reported almost $83 billion in holdings of MBS, most of that allocated to various kinds of MBS.
Why Did it Turn Out So Badly?
Having almost $83 billion in MBS securities might ordinarily pose no concern. That’s because while banks that focus on credit risk can manage that risk by diversifying or even hedging that risk, they are typically exposed to interest rate risk, which they try to hedge. But SVB had little credit risk (there’s still little concern now that MBS would default, given the implicit government backing, but lots of concern among bond investors including banks about further increases in interest rates causing bonds, such as MBS, to decline further in value). Instead, the business model was based on an interest rate risk bet – the bet was that interest rates would remain low, as they had been for a long time. But once rates began rising with inflation, the price of MBS and other securities began falling, generating losses. But there are two kinds of losses, realized, and unrealized.
In the U.S., when banks file their quarterly financial data with regulators, they have to disclose whether assets are available-for-sale (AFS), meaning the bank does not intend to keep them until they mature, or held-to-maturity (HTM), meaning the bank intends to hold them until they mature. This matters because in the call report data, the AFS securities get marked to market, while HTM securities do not. Funny enough after 2008, some commentary suggested marking-to-market was a cause of the crisis, but here, the lack of marking-to-market meant the unrealized losses grew dramatically, ultimately exceeding its capital buffer, the amount of non-run prone funding that SVB had. In addition, SVB’s capital, depending on how you measure it, looks low.
A Look at Bank Capital: How to Measure It
Larger banks, like SVB, tend to fund with less equity capital than smaller banks. Since a bank with less equity capital is more likely to default, the current preoccupation with bank size as a source of risk masks the bank leverage that’s also present, as I discussed in a public interest comment last year. I’ll show below how several large banks compare with SVB. But there’s more than one way to measure capital, in fact too many to discuss in such a short space; my co-author Jim Barth and I had to write a lengthy publication several years ago just to summarize how capital requirements have evolved since the 1980s. Here, I’ll focus on the primary regulatory measure, the Tier 1 capital ratio, and show how it differs from a simple book equity to book asset accounting measure and also a market equity to market value of asset measure.
Risk-Based Capital and Gaming
Under current regulatory guidelines, the primary measure that regulators and bankers focus on is the ratio of Tier 1 capital, which is similar to book equity, to risk-weighted assets, knows simply as the “Tier 1 capital ratio”. Risk-weighting allows banks to adjust the asset base that must be backed by capital. For instance, if a bank holds Treasuries or reserves at the Federal Reserve, the bank would not need any capital (the risk-weight could equal zero which you multiply by the 8 percent minimum required capital to be well capitalized). If it holds MBS, the bank might need 1.6 percent capital for every dollar invested (the risk-weight would be 0.2 multiplied by 8 percent minimum capital). For a mortgage, the bank might need 4 percent capital for every dollar invested (the risk weight would be 0.5 multiplied by 8 percent minimum capital). Lastly, for a standard commercial loan, the bank might need 8 percent capital for every dollar invested (the risk weight would be 1 multiplied by 8 percent minimum capital). As a simple example, if a bank had $10 billion allocated equally to assets in each risk bucket, it’s total assets would equal $40 billion, but the total risk-weighted assets would equal only $10 billion∙0 + $10 billion∙0.2 + $10 billion∙0.5 + $10 billion∙1 = $17 billion.
The Tier 1 capital to risk-weighted asset measure must equal or exceed 8 percent for the bank to be considered well capitalized. That means the bank must have Tier 1 capital equal to at least $10 billion∙0 + $10 billion∙0.016 + $10 billion∙0.04 + $10 billion∙0.08 = $160 million + $400 million + $800 million = $1.36 billion, as opposed to $3.2 billion if all asset categories had the same risk-weights.
But if a bank wants to fund with even less capital, it could game the risk-based measure by loading up on even more Treasuries, reserves and MBS, and reducing lending to reduce the risk-weighted asset measure, such that you would need a smaller amount of Tier 1 capital to reach 8 percent. In fact, Blake Hoarty and I showed how risk-based capital requirements gives banks incentives to hold more lower risk-weighted assets such as Treasuries and reserves and less higher risk-weighted assets such as loans. That’s one way to think about what SVB, like other large banks, did. Also, when regulators define risk-weights for bank assets, there’s no guarantee that they will actually reflect the underlying asset’s risk.
Book Equity vs. Market Equity Capital Ratios
In general, a bank that funds with more equity capital will be more resilient in the face of shocks. In addition, a healthier bank will have a market equity to quasi-market value of asset leverage ratio that lies above the book equity to asset leverage ratio; by quasi-market value of assets, that means I use a simple estimate of the market value of assets that starts with the book value of assets, subtracts the book value of equity and adds back the market value of equity (the number of shares multiplied by the share price). Looked at another way, if the market value of equity exceeds/lies below the book value of equity, that might be a stock worth/not worth holding.
Some Risk-Based, Book Equity and Market Equity Capital Ratios in 2022
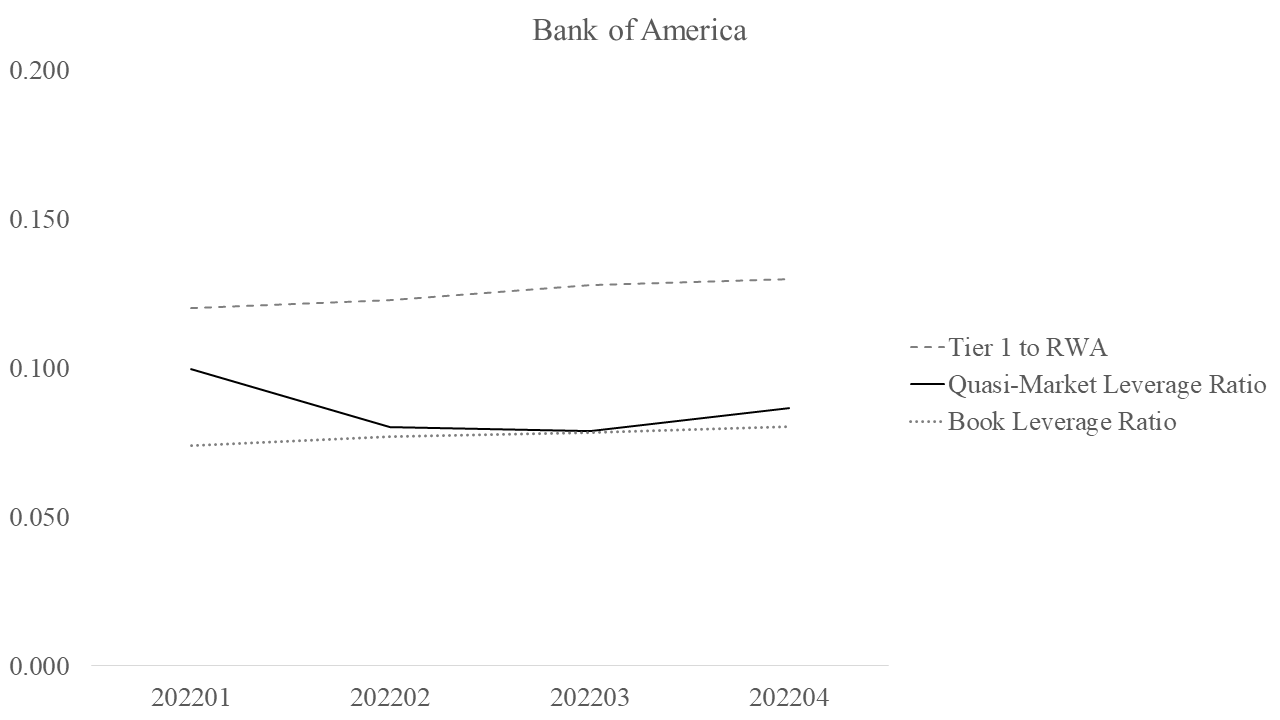
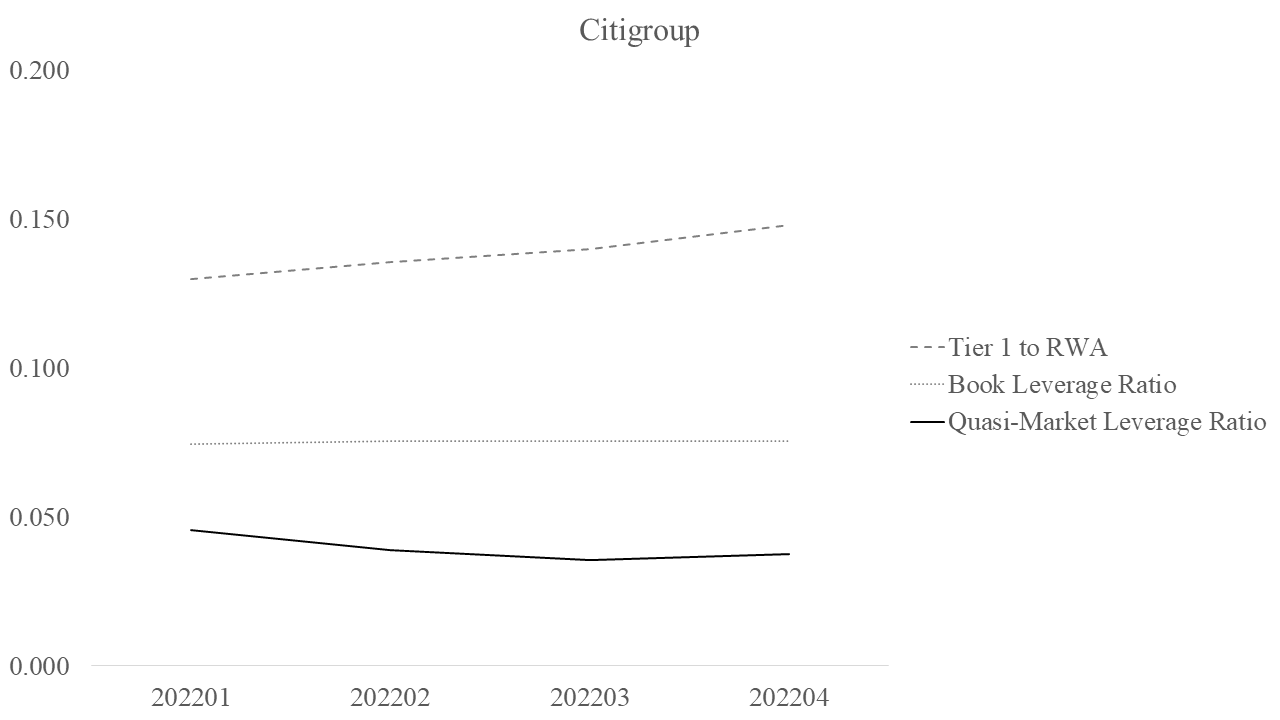
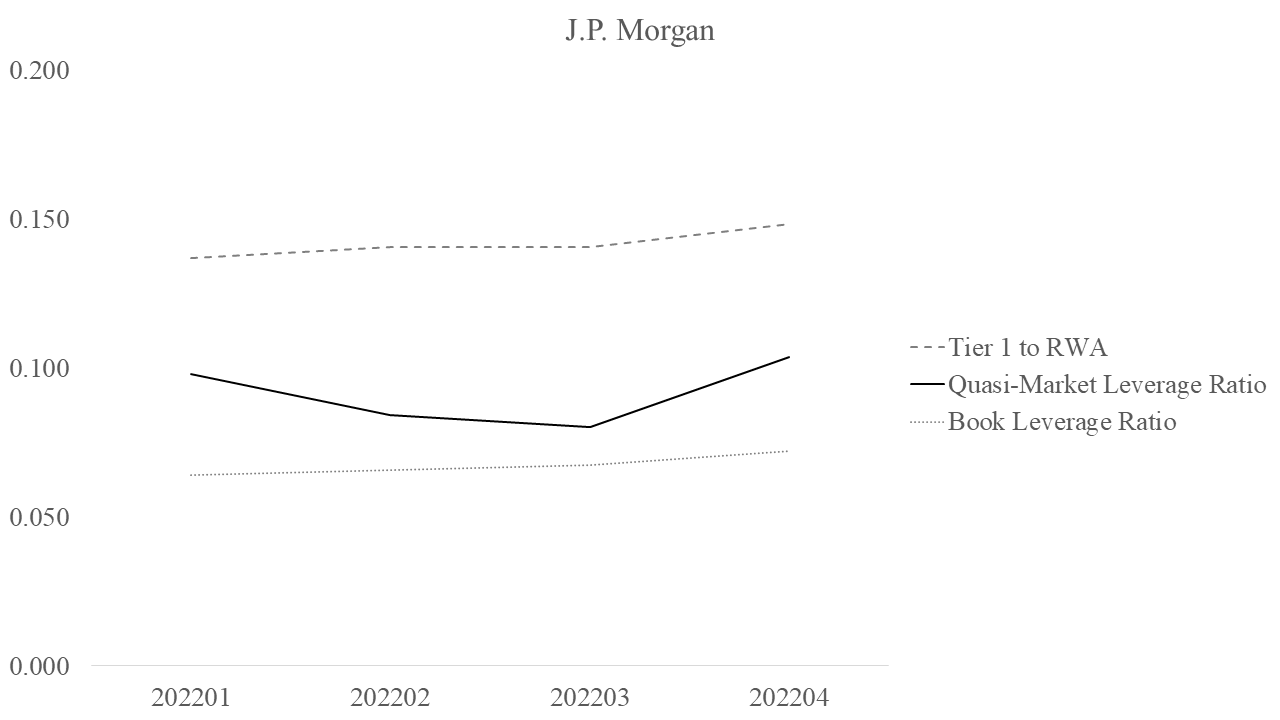
I compare risk-based capital ratios from the Consolidated Financial Statements (FR 9-YC) forms available from this link for large bank holding companies and compare those ratios to the book equity to asset and quasi-market equity to asset ratios I compute from the CRSP-Compustat database for Q1-Q4 2022. The holding companies that I compare include some of the largest banks that were at the center of the 2008 Crisis (Bank of America, Citigroup, JP Morgan, Wells Fargo, Goldman Sachs and Morgan Stanley) as well as SVB and Silvergate. In all cases, the risk-based Tier 1 capital to risk-weighted asset measure lies above the other measures. In some cases, the market capital ratio lies above the book ratio, but in other cases it does not, in which case, that should raise concerns.
Bank of America
The Tier 1 to risk-weighted asset ratio, the key capital ratio under the Basel framework makes Bank of America appear well capitalized. However, the quasi-market and book leverage ratios appear lower, with the latter lying above the former through Q4 2022, above 5 percent.
Citigroup
With Citigroup, the risk-based measure also exceeds the other two measures. Also, the quasi-market leverage ratio lies below the book leverage ratio, and is now under 5 percent. While that's better than at the peak of the 2008 crisis, that remains something to watch.
J.P. Morgan
J.P. Morgan’s risk-based measure also exceeds the other two measures. The quasi-market leverage ratio lies above the book leverage ratio, and in the most recent quarter, it lies above 10 percent.
Wells Fargo
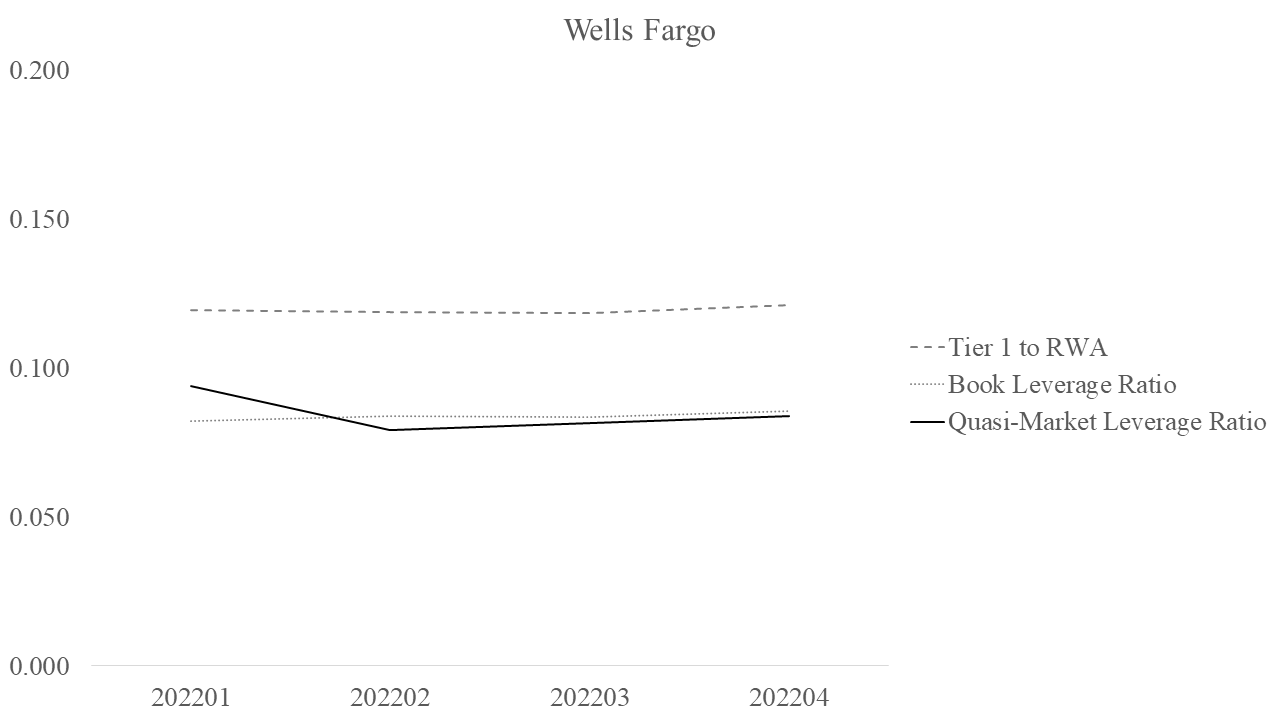
Wells Fargo’s risk-based measure also exceeds the other two measures. The quasi-market leverage ratio is just under the book leverage ratio but both are above 5 percent.
Goldman Sachs
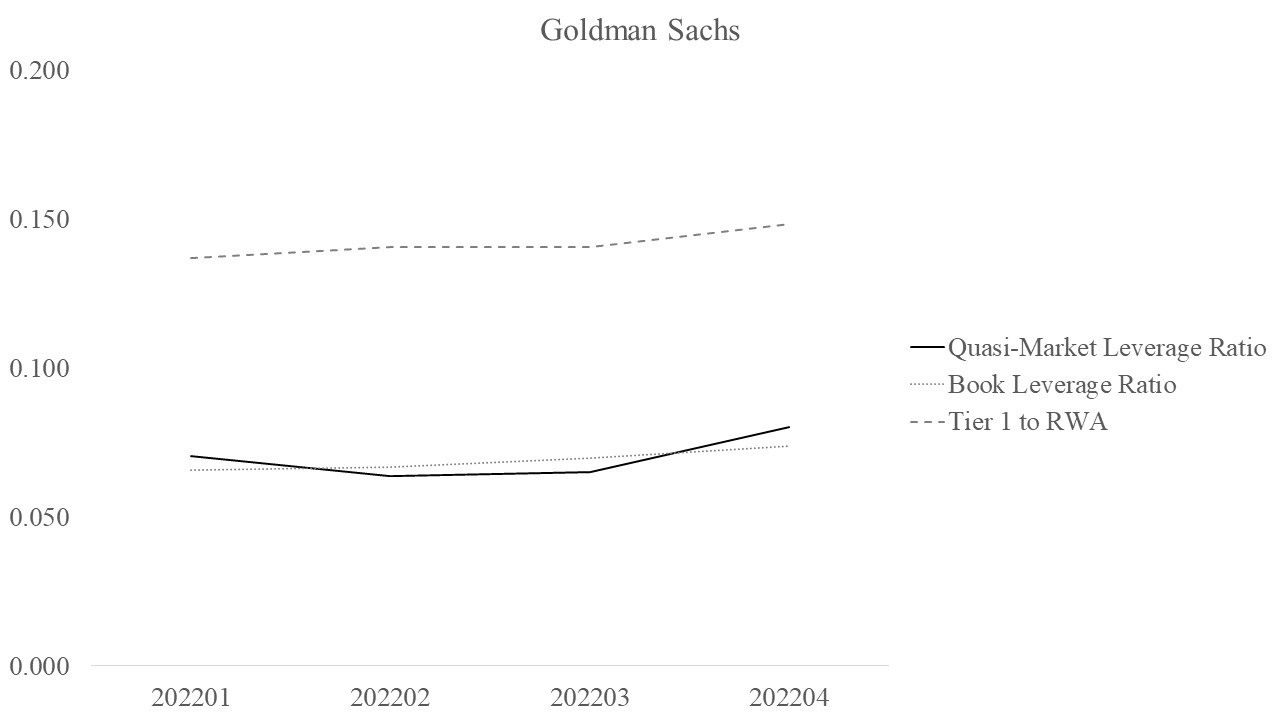
Goldman Sachs’s risk-based measure also exceeds the other two measures, and the quasi-market leverage ratio is similar to its book leverage ratio and both lie above 5 percent.
Morgan Stanley
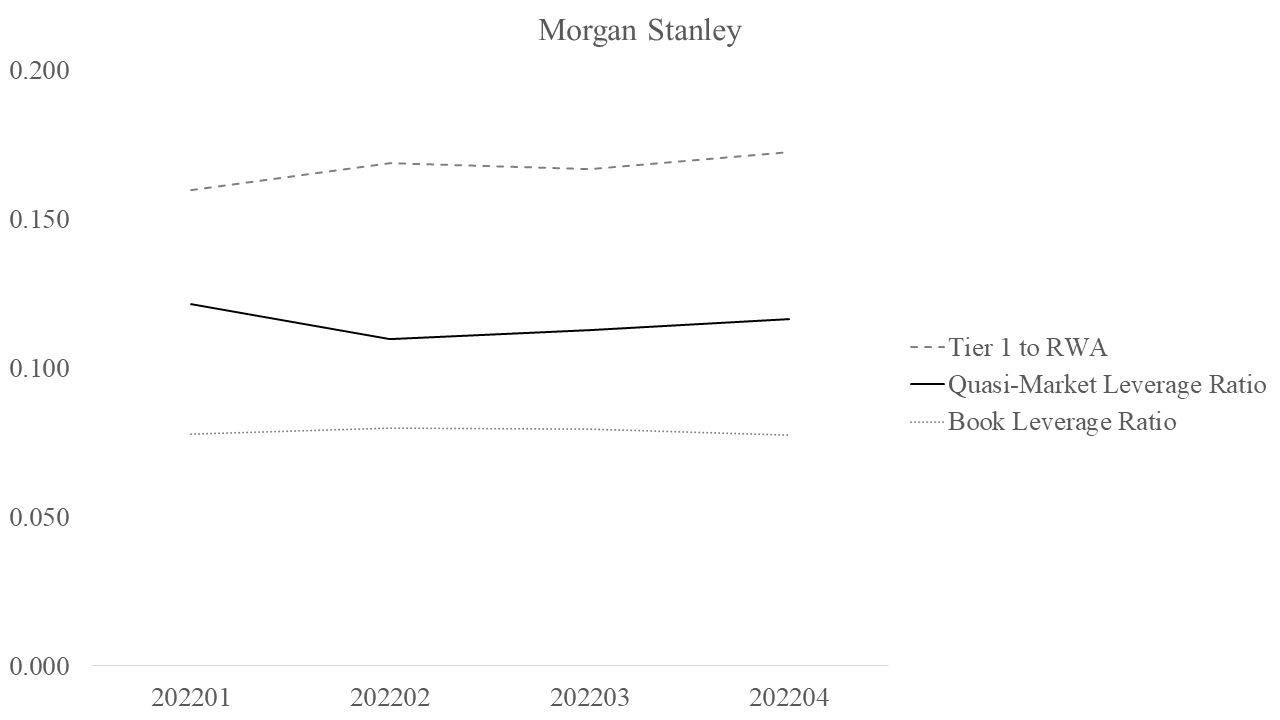
Morgan Stanley’s risk-based measure also exceeds the other two measures, the quasi-market leverage ratio exceeds 10 percent while the book leverage ratio exceeds 5 percent.
Now for two banks that have been in the headlines, namely, SVB, which failed and Silvergate, which wound down before failing.
SVB
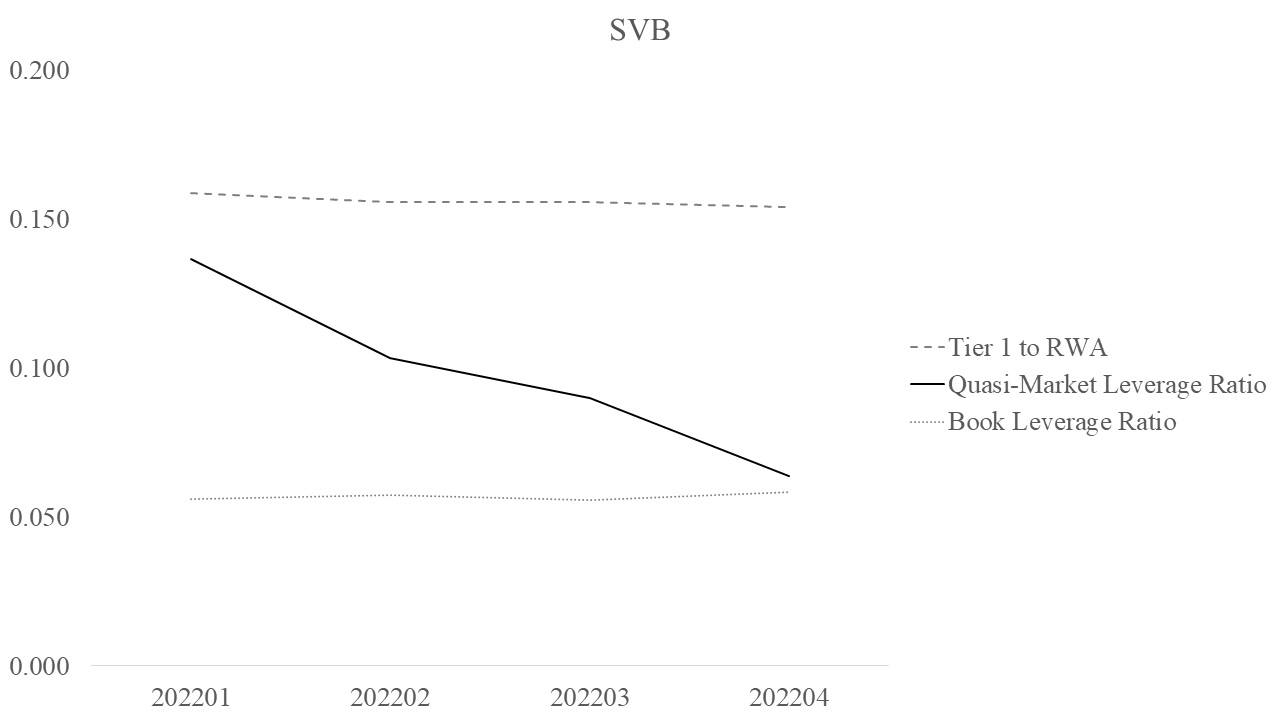
SBV’s risk-based capital measure exceeds the other two measures. SVB had a very high quasi-market leverage ratio (nearly 15 percent) in early 2022, much higher than the book leverage ratio which equaled only about 6 percent. But throughout 2022, the market value of equity fell dramatically, reflecting the fact that some equity investors could have been withdrawing from the bank.
Silvergate
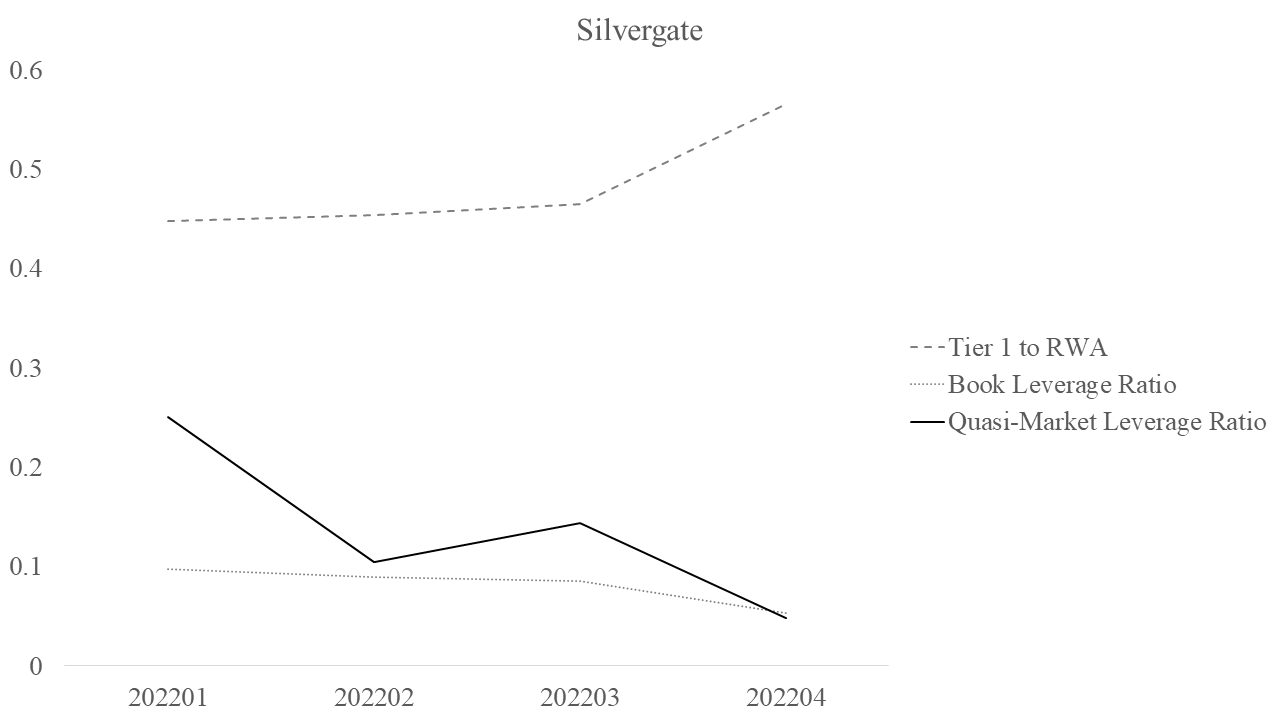
Silvergate had an extraordinarily high risk-based capital ratio that equaled 56.58 percent in Q4 2022. To understand why, in examining the bank call report (especially pp. 18, 19 and 58) similar to what I reported for SVB, Silvergate’s assets consisted primarily of reserves, roughly $4 billion, and over $5 billion in available-for-sale securities, mostly MBS and Treasuries. The bank lent very little. The market-leverage ratio was also quite high, exceeding 20 percent in Q1 2022. However, for the remainder of 2022, the quasi-market leverage ratio declined rapidly ending below 5 percent and even the book values declined.
Was SVB’s Failure Due to “Trump Rollbacks”? Probably Not
Some recent commentary suggests that SVB’s failure was due to Dodd-Frank reforms in 2018, often simply referred to as “Trump Rollbacks”. At the time, I wrote a blogpost on whether the associated changes in the law would cause a repeat crisis, and as I had written quite a bit on the 2007-2009 Crisis. I concluded that since low bank equity capital was a key issue in the last crisis, changes in the law were not likely going to cause a repeat crisis, since the law made minimal changes to equity capital requirements, and those changes primarily concerned smaller banks.
As I showed above, SVB and Silvergate had little equity capital. SVB seems to have had poor bank risk management, and I wonder if bank supervision was sufficient, and if you add to that having little equity capital that seems to explain why SVB failed. But this and other recent failures deserve a proper inquiry before further legal and regulatory changes take place. As eminent economic historians, Larry Neal and Eugene White, wrote in 2012, the Dodd-Frank Act, like the Glass-Steagall Act during the Great Depression, was passed without a full independent inquiry pertaining to causes of the 2007-2009 Crisis. The Financial Crisis Inquiry Commission Report was released after the passage of Dodd-Frank. Hopefully, this time we will see a full inquiry before changes take place.
Concluding Thoughts
Bank insolvency primarily concerns leverage, as well as asset risk. In the current inflationary bear market, both longer-term bonds and stocks have declined significantly in value. The decline in the value of bonds, even high grade ones, has adversely affected asset portfolios for many banks, especially larger ones, which tend to hold a larger share of assets in such securities. That was especially the case with SVB, whose management chose to take on rather than hedge interest rate risk, given that its small loan portfolio would not have generated the revenues from credit risk that most banks rely on. Given the decline in the value of the stock market, including bank stocks, as well as the higher stock market volatility, investors look for safer and more sound investments to hold. Banks with more equity capital, especially when measured at market rather than book values, all else held constant, should indicate a safer bank.


