On The Rise of U.S. Bank Regulatory Restrictions
In this and the next few posts, I’ll generate some stylized facts concerning the rise of federal level bank regulation embodied in Title 12…
In this and the next few posts, I’ll generate some stylized facts concerning the rise of federal level bank regulation embodied in Title 12 of the Code of Federal Regulations (CFR). I’ll use the so-called meta data from the QuantGov website. For a description of the methodology used to construct the data see McLaughlin, Patrick A., and Oliver Sherouse. 2017. “QuantGov — A Policy Analytics Platform”.
The meta data file includes word counts and regulatory restrictions, which are comprised of words such as “shall”, “must”, “may not”, “required” and “prohibited”, by CFR title, as well as by part within each title. As I’m limiting this series to the study of bank regulation, I’ll only use data on Title 12. Also, I’m primarily interested in the three major federal regulators: the Office of the Comptroller of the Currency (OCC), the Federal Reserve and the Federal Deposit Insurance Corporation (FDIC). So I’ll ignore the other parts of Title 12, including those covering the Office of Thrift Supervision, which was abolished under Section 313 of the Dodd-Frank Act.
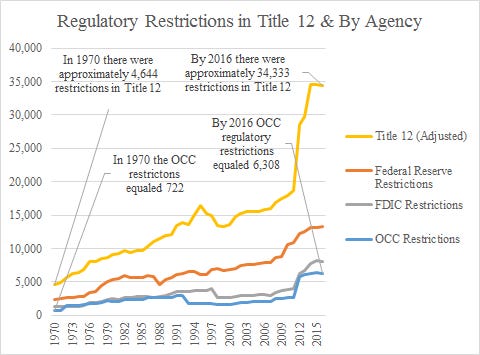
In Title 12, parts 1–199 cover the OCC, parts 200–299 cover the Federal Reserve and parts 300–399 cover the FDIC. The OCC regulates banks with a national charter. The Federal Reserve regulates bank and financial holding companies, as well as banks with state charters that are Federal Reserve member banks, among others. The FDIC regulates banks with state charters that are not Federal Reserve member banks. Therefore, some overlap may exist, so to avoid overstating the number of regulatory restrictions, I attempt to adjust for potential regulatory overlap. I depict the first set of results for regulatory restrictions below.
The figure below shows the number of restrictions for each of the three primary regulators, as well as the adjusted measure for Title 12. The adjustment to Title 12 entails subtracting from the total number of regulatory restrictions in Title 12 the number of regulatory restrictions for the three major regulators and adding back in the median of the three.

The graph shows that restrictions for the three primary regulators have generally risen, as has the total number of restrictions in Title 12. Some of the sharp rise in Title 12 after 2011 is due to the creation of the Bureau of Consumer Financial Protection (CFPB). The minimum across the three regulators in 1970 was 722, while the minimum in 2016 was 6,308. In 1970, Title 12 included approximately 4,644 restrictions, and by 2016 that had grown to 34,333. The median growth rate between 1971 and 2016 was 1.4% for the OCC, 2.5% for the Federal Reserve, 2.6% for the FDIC and 3.3% for the adjusted measure of Title 12. I report the median since notable “outliers” exist, too.
OCC restrictions grew by 10% or more in 1972 (71%), 1976 (13%), 1979 (11%), 1986 (10%), 1991 (11%), 2008 (19%) and 2012 (78%). Federal Reserve restrictions grew by 10% or more in 1971 (11%), 1976 (19%), 1978 (22%), 1979 (11%), 1989 (15%), 1997 (11%), 2010 (19%) and 2012 (12%). FDIC restrictions grew by 10% or more in 1976 (28%), 1979 (12%), 1982 (11%), 1991 (10%), 2008 (13%), 2012 (45%) and 2014 (15%). Adjusted Title 12 restrictions grew by 10% or more in 1972 (13%), 1976 (16%), 1991 (11%), 1994 (10%), 2012 (42%) and 2014 (15%).
There were also some years during which the number of regulatory restrictions contracted, but the magnitude of the declines were generally under 5%. Exceptions to that rule for the OCC include 1980 (-5%) and 1993 (-53%); the large decline in 1993 seems due to the reduction from 1417 to 7 regulatory restrictions in Part 11 — Securities and Exchange Act Disclosure Rules. Exceptions for the Federal Reserve include 1988 (-24%) and 1995 (-7%); the large decline in 1988 seems due to the reduction from 1272 to 0 regulatory restrictions from Part 206 — Limitations on Interbank Liabilities (Reg. F). Exceptions for the FDIC include 1998 (-40%), which seems due to the large decline from 1361 to 68 regulatory restrictions in Part 335 — Securities of State Nonmember Banks and State Savings Associations. Larger negative declines are not reflected in the more aggregate adjusted measure of Title 12 restrictions, where the two largest declines occurred in 1996 (-8%) and 1998 (-10%).
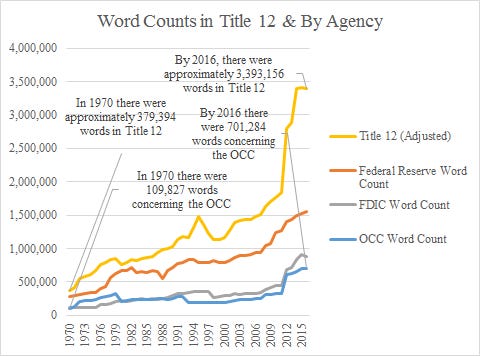
Lastly, I’ll confirm the general patterns found with the regulatory restrictions using word counts. I make a similar adjustment to Title 12, by subtracting from the total number of words found in Title 12 the total number of words concerning the three primary regulators and adding back in the median of the three.

As with the regulatory restrictions, the figure shows that there exist brief periods when the number of words in the CFR concerning bank regulation declines, but overall the number of words has risen. The median growth rate between 1971 and 2016 was 2.7% for the OCC, 2.9% for the Federal Reserve, 2.8% for the FDIC and 3.3% for the adjusted measure of Title 12.
I’ll flesh out some more stylized facts concerning the rising regulatory burden facing banks in future posts.

