

(Updated) Some initial questions about the Cleveland Fed P2P study
Update: The Cleveland Fed has removed the working paper for revision.
Update: The Cleveland Fed has removed the working paper for revision.
Economists at the Federal Reserve Bank of Cleveland, the University of Virginia, and the University of Maryland released a working paper* Friday that casts doubt on some of the most cherished narratives of innovative lending. Specifically, the paper’s authors present evidence they think undermines claims that peer-to-peer loans are used to refinance debt, help borrowers improve their credit scores and build their credit history, and extend credit to under-served borrowers. These findings run counter to other analysis (including a recent study by economists at the Philadelphia and Chicago Federal Reserve Banks that looked at Lending Club) and could be an important part of the policy debate. The paper in its current form, however, leaves a lot of questions to be answered.
What follows is a preliminary and non-exhaustive list of questions I have about the current version of the working paper. My intention is not to argue that the paper’s ultimate conclusions are wrong, but to highlight areas in which a lack of transparency prevents a full evaluation of the argument.
What is “peer-to-peer” anyway?
The most fundamental question that the paper does not answer is what types of loans and lenders are included by the authors in their analysis. While the paper refers to peer-to-peer loans (loans where a borrower is matched with one or more individual lenders via a platform intermediary), the paper does not appear to limit its scope to just those lenders. Instead it looks at loans from “P2P and related online lenders (collectively referred to as P2P lenders)” (emphasis added) but doesn’t tell us what “related” means. If the universe of lenders isn’t bound by the use of peer-matching for funding, the paper should specify the relevant universe of lenders.
Table 1 on pg. 36 of the paper is a “non-exhaustive list of online platforms that provide consumer-loan services as of July 2017”. However, while this table includes many of the firms generally referred to as P2P, marketplace, or fintech lenders (e.g., Lending Club, SoFi, Avant, and Prosper), it also includes numerous banks (e.g., USAA, First Midwest Bank, and Discover), credit unions (e.g., SAFE Credit Union, and Tower Federal Credit Union) and non-bank finance firms that predate what is generally considered to be the start of the “fintech” lending era (e.g., Freedom Financial, and OneMain Financial). While this table probably doesn’t represent the universe of lenders that the authors counted as “P2P” for their analysis of loans in the 2007–2012 period, the inclusion of disparate types of lenders with different business models as an illustrative sample further confuses the question of just what counts as a “P2P” lender for the purposes of this paper’s analysis.
Likewise, the total balances of P2P loans reported by the authors seems significantly higher than what other sources report. For example, the authors say that outstanding P2P balances in 2010 were just a little under $50 billion, but TransUnion has FinTech lenders only originating around $27 million loans in 2010.** These are not apples-to-apples comparisons since balances outstanding reflect several years of loans while balances originated reflect the loans originated in that year. But still, if FinTech lenders did under $1 billion in new business in 2010 it seems unlikely they did ~$48 billion in the years prior, so who is making up the difference? This again highlights the problem with the lack of transparency in the definition of what lenders are included in the report.


Like the definition of lender, the type of loans the authors are evaluating is also hard to determine. While as part of their analysis the authors compare P2P borrowers with non-P2P borrowers “who obtain traditional term loans compatible in size to P2P loans,” they don’t explain what those loans are.
This isn’t to say that there aren’t definitional issues when talking about innovative lending (there are), or that the authors aren’t entitled to define the universe as they see fit (they are), but we in the audience need to know what definition the authors used so we can evaluate whether or not it makes sense.
Update: Apparently the data set used in the study “does not distinguish the various types of online lenders.” This indicates that the researchers don’t know which loans come from a which type of lender (P2P, other fintech, traditional finance company, etc.) This also makes the decision of the authors to frame the discussion around P2P lenders questionable, since they do not know what percentage of the relevant loans were from P2P lenders and whether P2P borrowers performed in line with the other types of lenders.
What is the law?
The paper briefly touches on the regulatory environment for P2P lenders, which again highlights the problem with having the universe of lenders being so poorly defined, since the regulation that applies to any particular lender will depend to some degree on its legal status (e.g., bank versus non-bank) and its business model (e.g., bank partnership versus direct lending). Putting these problems aside, the legal analysis appears to be mistaken in several important respects.
The paper contrasts banks with P2P lenders by saying that while “many of the major consumer protection laws” “arguably” apply to P2P lenders, they are not subject to direct supervision by regulators “for compliance with consumer protection laws” and that there is “no specific regulatory body dedicated to overseeing P2P marketplace lending practices”. Further, the paper asserts that “enforcement is delegated to local attorney general offices and is triggered by repeat violations…leaving P2P borrowers vulnerable to lending practices that are potentially predatory.”
The paper’s description is at best a significant understatement of the regulatory picture facing P2P lenders (however defined). First, as the United States Department of the Treasury pointed out in its report on marketplace lending, federal consumer protection laws apply equally to banks and marketplace lenders (pg. 10 and Appendix A). Further, the CFPB has jurisdiction over non-bank lenders to prevent unfair, deceptive, or abusive acts or practices and violations of federal consumer financial law.
Additionally, lenders that partner with banks are subject to regulation and supervision by the bank’s regulator under the Bank Service Company Act (BSCA), and non-depository lenders can come under CFPB supervision under certain circumstances. Even lenders who operate purely with state licenses and therefore are not covered by the BSCA may face examination. Numerous states require regular examination as a condition of obtaining and maintaining a lending license (e.g., Virginia, Tennessee, California, New York, and Texas). While a debate can be had as to whether state-by-state regulation is a good idea (and that debate is going on as we speak in the context of the OCC fintech charter), it is inaccurate to say that state-licensed lenders as a whole are not subject to proactive examination. It is possible that there is some set of what the authors consider P2P lenders that are much more lightly regulated than other lenders, but, at a minimum, the authors overstate their case with regard to many of the lenders generally thought of as P2P.
Who are the borrowers?
The authors compare certain characteristics of individuals who did or did not take out a P2P loan between 2007 and 2012. They try to pair P2P and non-P2P borrowers with similar economic characteristics. A few questions stand out to me that I would love the authors to clarify in the next iteration of the paper.
First, 2007 was both early in the life of P2P lending and early in the financial crisis, which extended through most of the study’s sample. While I understand that the authors wanted to limit their analysis to a set of years where they are able to compare borrowers for two years before and two years after the loan’s origination, there is a question whether P2Ps’ early years or the crisis experience is representative of P2P lending outcomes today, or if the value is primarily historical. In a little over a month, there will be four years of post-loan history for borrowers who obtained loans in 2013. Adding newer data sets would make the analysis more informative for policymakers.
Second, do they match borrowers on the basis of age? Age is a potentially relevant factor in determining both a consumer’s need for credit and her ability to repay. Age could influence whether a debt-to-income ratio going up is a good thing or a bad thing.
Third, do they control for borrowers’ (or the borrowers’ spouses) losing their jobs after they take out a loan? Given the number of jobs lost in the 2007–2012 period due to the crisis this could be a relevant factor.
Fourth, do they match borrowers on the basis of the interest rate charged on the loan? The interest rate offered to a borrower may reflect information that was available at the time the borrower applied that might not show up in the other propensity matching criteria.
Finally, what, if anything, has been done to screen out fraudulent loans? Online lending has seen higher rates of borrower fraud than more traditional lending. The extent to which fraud on the borrower side contributes to negative outcomes, is relevant to the question of whether these loans are inherently problematic for borrowers.
How do P2P loans compare with similar credit cards?
The report notes that not every P2P borrower can obtain loans at an interest rate comparable to credit cards and points to a chart comparing Lending Club rates with credit card rates, but the comparison raises questions. The authors point to Lending Club borrowers with C and D grades (mediocre credit) with the average credit card rate and find that the average Lending Club C and D grade loan has a slightly higher rate than the average credit card (which would be influenced by the good credit risk borrowers excluded in the C and D Lending Club average).

Shouldn’t loans going to mediocre Lending Club borrowers be compared with credit cards offered to mediocre borrowers and the average Lending Club loan be compared to the average credit card? The chart in the report does show the difference between the average Lending Club borrower and the average credit card, and the Lending Club rate is a few points lower. It would be useful for the authors to compare rates for C and D grade borrowers from Lending Club with the rates credit cards charge comparable credit risks Further, if mediocre credit risks can obtain a rate close to that charged the average credit card borrower, that fact seems to support the lower cost of credit argument, at least for Lending Club.
Is the mortgage crisis really a good comparison?
The report includes a couple of graphs that compare rates of delinquencies for mortgages issued between 2001 and 2007 and P2P loans (however defined) issued from 2006 to 2013 to show that there is a similar trajectory.
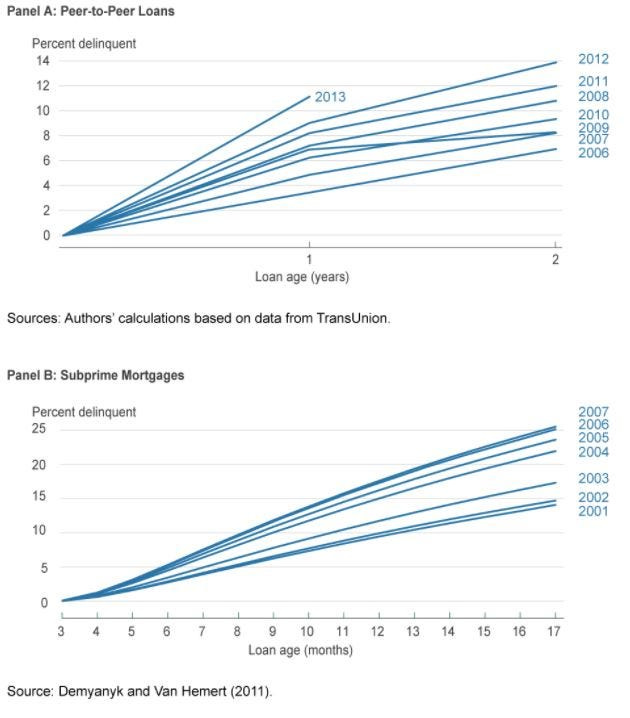
While those lines look similar, note that both the X and Y axis use different measurements. For mortgages, the Y-axis goes up to twenty-five percent, while for P2P it only goes up to fourteen. Likewise, the X-axis measures time, but for mortgages it only goes to seventeen months while the P2P graph goes for twenty-four months. I placed both results on the same graph using the same axis labeling and the resemblance is less stark. (Note — I just eyeballed the numbers so don’t take this result as 100% accurate but it does give a sense of the general results).

It would be helpful for the authors to update their charts with more data on the performance of both mortgages and P2P loans using common labeling to help assess how close a parallel there actually is.
Conclusion
To reiterate, the questions above (and subsequent questions that might come) do not mean the findings of the report are wrong. This report on the impact of P2P lending could be a valuable contribution to the debate around innovation in credit access, but more transparency as to what is being studied and the methodology would be extremely helpful in allowing others to assess its findings. As the working paper evolves, I hope the authors will provide more information.
* The working paper reflects the views of the authors and not the Federal Reserve Bank of Cleveland
** Correction: I initially misread the TransUnion chart to say fintech lenders originated $.9 billion in loans in 2010 when it actually said they originated .9% of the ~$30 billion loans originated, or roughly $27 million.